


-
Bitcoin price stabilizes near $106,400, just 3% below its all-time high of $109,588.
-
Ethereum holds firm at the 200-day EMA near $2,441, showing signs of strength.
-
XRP stays above the 50-day EMA at $2.28, despite waning momentum.
Bitcoin price inches closer to its all-time high
Bitcoin (BTC) price holds steady around $106,400 as of Wednesday, keeping within 3% of its January 20 record high at $109,588. The crypto market currently reflects a wait-and-see stance, with traders monitoring if BTC can breach its previous peak, and whether Ethereum (ETH) and Ripple (XRP) can hold key technical levels.
Bitcoin recently broke above its $105,000 resistance on Sunday, retested it Monday and Tuesday, and is now stabilizing near $106,700.
If BTC maintains support above $105,000, the price could climb toward the all-time high at $109,588.
The Relative Strength Index (RSI) on the daily chart reads 71 and is trending higher, indicating strong bullish momentum. Still, traders should be alert to a possible pullback due to the RSI exceeding overbought conditions. The Moving Average Convergence Divergence (MACD) is coiling, reflecting market indecision.
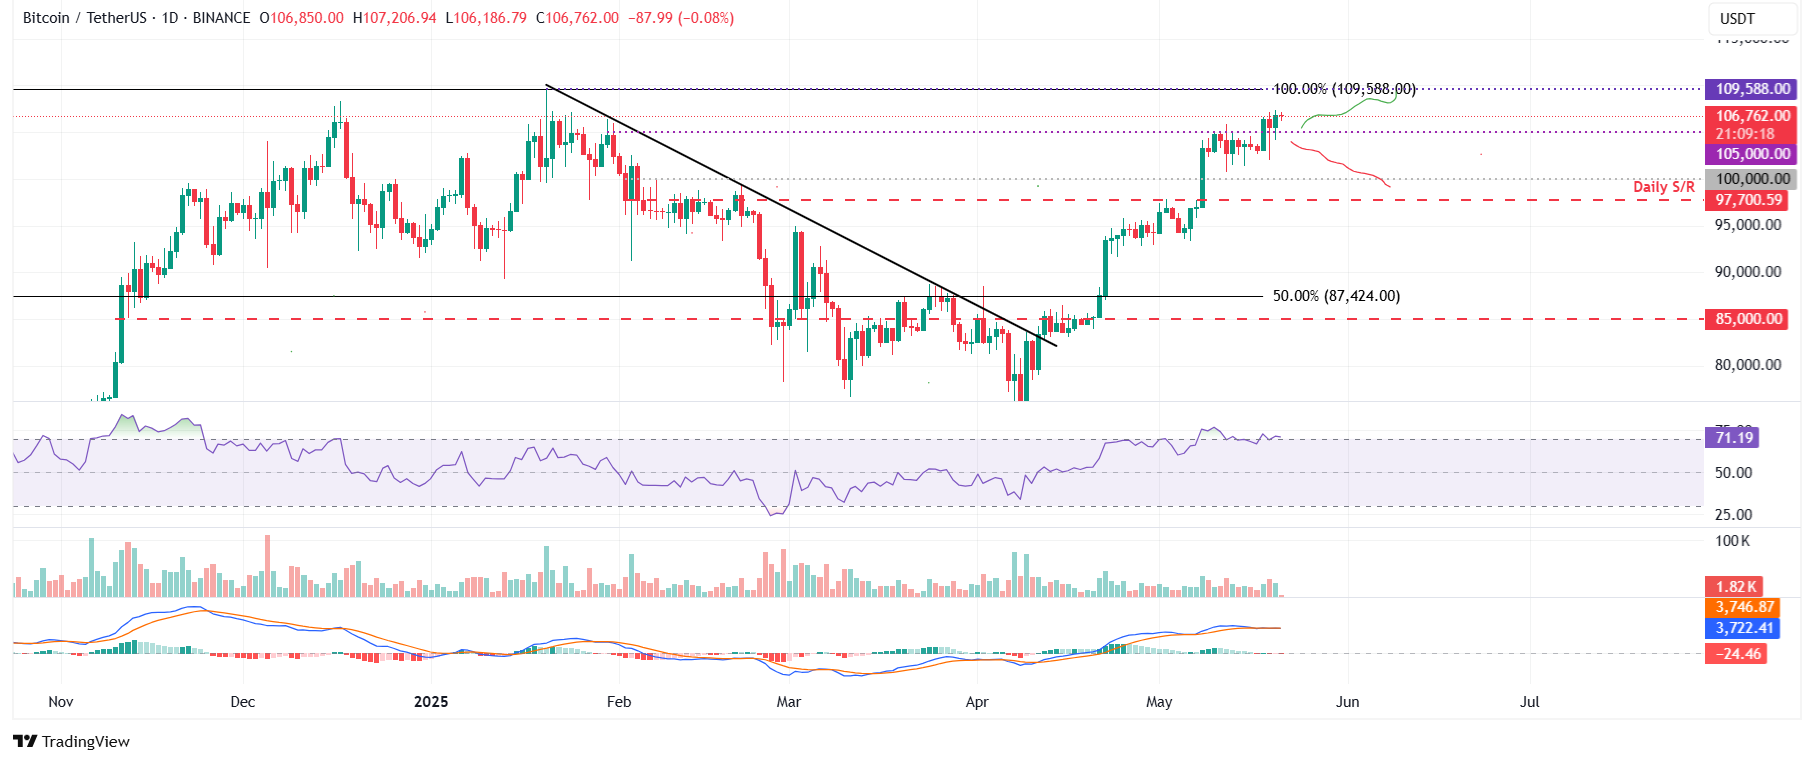
However, a close below $105,000 would likely trigger a retreat toward the key psychological support at $100,000.
Ethereum eyes a recovery as it holds strong around the 200-day support
Ethereum (ETH) price has been hovering around its 200-day Exponential Moving Average (EMA) near $2,441 since Sunday and currently trades around $2,500.
If ETH continues to hold above its 200-day EMA and gains strength, it could retest the psychological resistance at $3,000.
The daily RSI currently reads 69, moving toward overbought territory. This suggests bullish momentum, though overbought signals also raise caution for a potential reversal. Alternatively, sustained RSI above 70 may confirm continued strength.
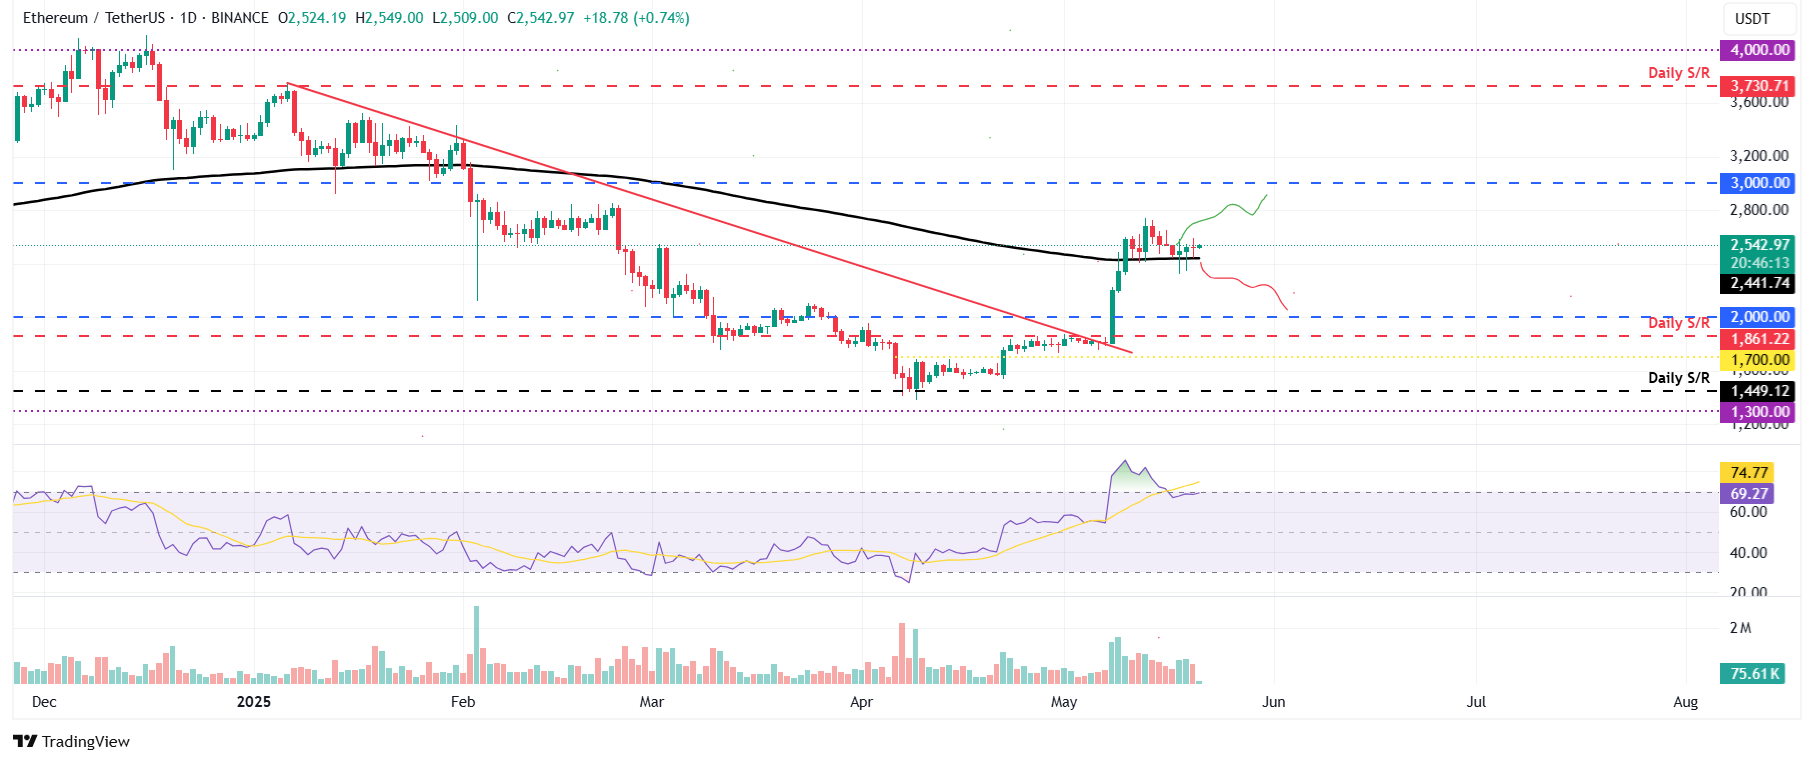
However, if ETH closes below the $2,441 level, the price could slide further to retest the $2,000 psychological level.
XRP holds ground despite weakening momentum
XRP price rebounded off its 50-day EMA at $2.28 on Saturday, gaining 3.18% the next day. Despite slipping slightly on Monday, it has since remained above this key level.
Should XRP break and close below the 50-day EMA, a further drop toward the next support at $2.23 is likely.
The RSI currently sits at 52, drifting toward the neutral level of 50, signaling waning bullish strength. If the RSI falls below 50, bearish momentum could intensify, potentially triggering a sharp price drop. Meanwhile, the MACD showed a bearish crossover on Monday, indicating growing weakness and signaling potential downside.
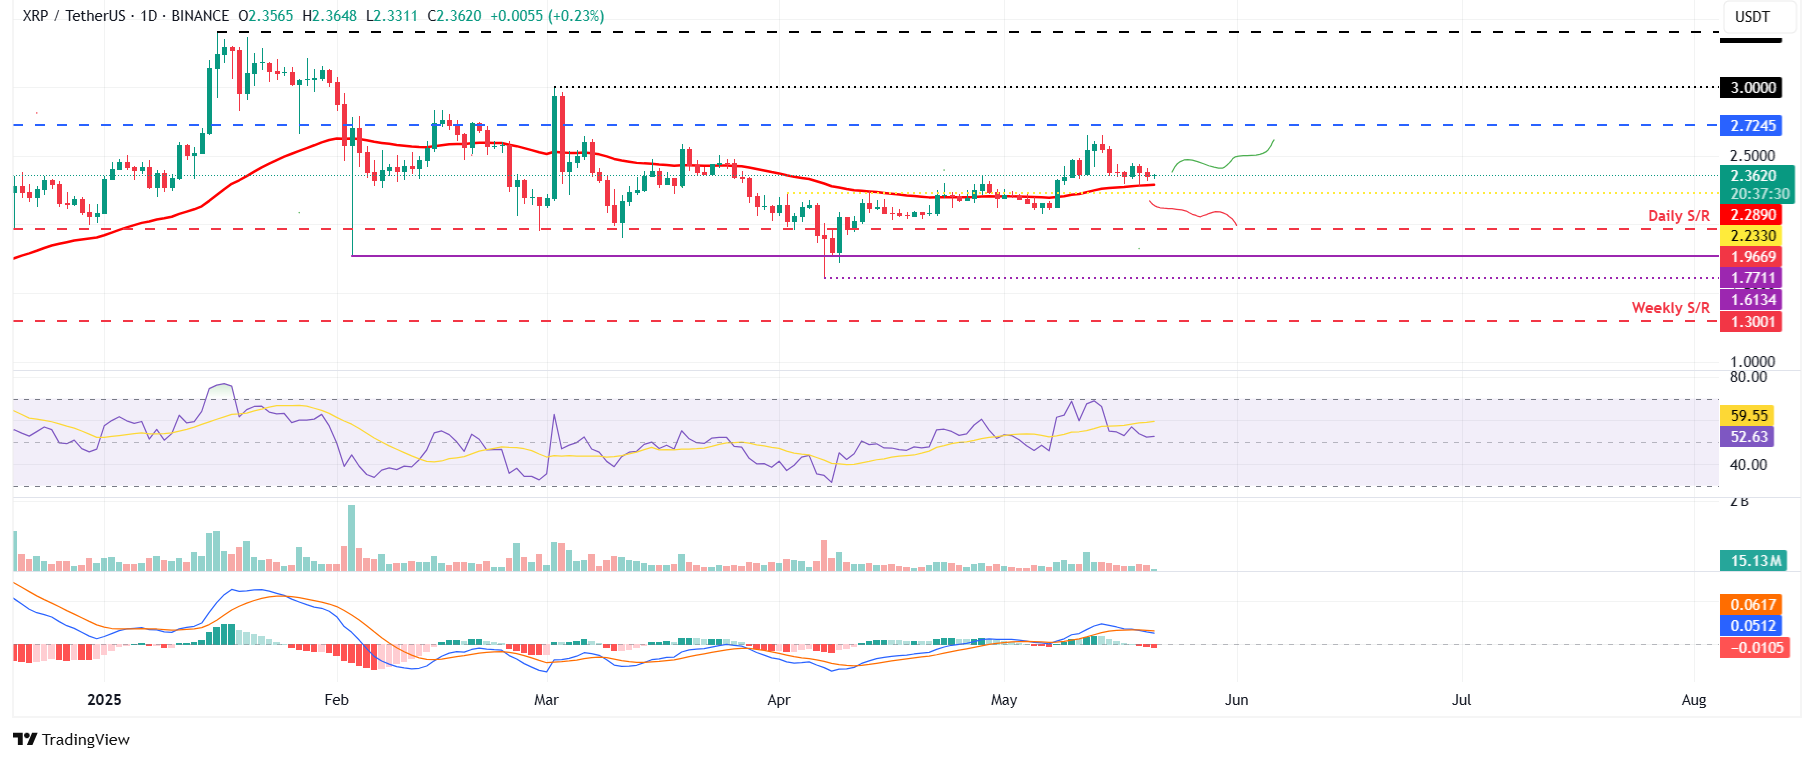
Conversely, if XRP defends its 50-day EMA support, it could rally to retest resistance at $2.72.