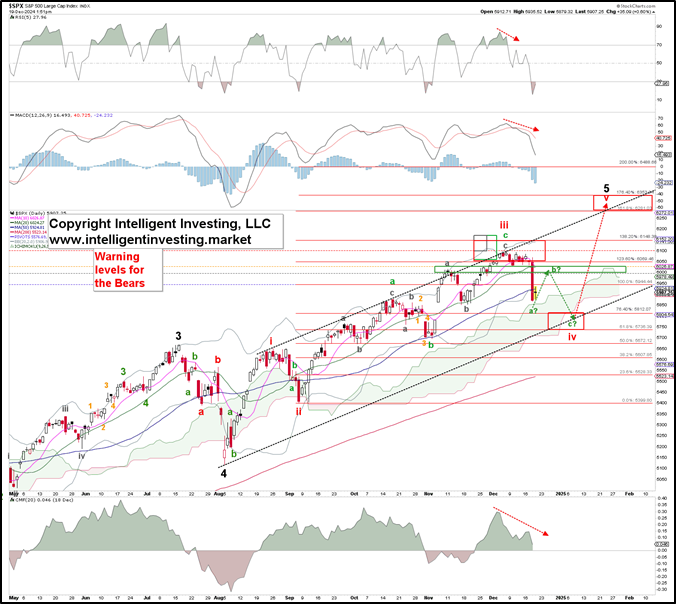
The S&P 500 has recently experienced significant volatility, prompting investors to question where the index might find its bottom. Historically, the 200-week moving average has served as a critical support level during market downturns. In previous corrections, such as those in 2011, 2016, 2018, and 2022, the S&P 500 found support near this average, suggesting its importance in current market analysis.

Source – FXStreet
As of December 20, 2024, the S&P 500 is trading at 5,861, with the 200-week moving average estimated around 5,870. This proximity indicates that the index is testing this support level, which could potentially signal a market bottom if it holds. However, a decisive break below this average may lead to further declines, making it a crucial indicator for investors to monitor.
Market sentiment and psychological indicators also play a significant role in identifying market bottoms. Elevated levels of fear, as measured by the Volatility Index (VIX), and high put/call ratios often coincide with market lows. Currently, these indicators suggest increased investor anxiety, which contrarian analysts might interpret as a bullish signal.


